Scale Efficiency in Excel: A Practical DEA Example with XelDEA
Learn how to calculate Scale Efficiency in Excel using DEA models
Unlock the power of Scale Efficiency in Excel with a practical example using XelDEA! 🚀 Learn how to measure Returns to Scale (RTS)—whether Increasing (IRS), Constant (CRS), or Decreasing (DRS)—and analyze efficiency in banking performance. This step-by-step tutorial will guide you through DEA analysis in Excel, showing how DMUs transition from inefficient to efficient states.
🔹 Understand Scale Efficiency in Excel
🔹 Perform DEA in Excel with XelDEA
🔹 Analyze Returns to Scale (IRS, CRS, DRS)
🔹 Generate insightful efficiency reports & visualizations
Scale Efficiency in Excel: A Practical DEA Example with XelDEA
Introduction Measuring Scale Efficiency (SE) is essential in Data Envelopment Analysis (DEA) to determine whether an organization operates at its most productive scale. Scale efficiency helps assess whether a decision-making unit (DMU) benefits from increasing, decreasing, or constant returns to scale (RTS). In this guide, we will use Excel and XelDEA to compute scale efficiency and interpret the results with a practical example.
Step 1: Understanding Returns to Scale (RTS)
In DEA, returns to scale explain how a change in input levels affects output levels. There are three types(Scale Efficiency in Excel):
Constant Returns to Scale (CRS): A proportional increase in inputs leads to a proportional increase in outputs.
Increasing Returns to Scale (IRS): A proportional increase in inputs leads to a more than proportional increase in outputs.
Decreasing Returns to Scale (DRS): A proportional increase in inputs leads to a less than proportional increase in outputs.
To determine RTS for each DMU, we compare the efficiency scores under the CCR (constant returns to scale) model and BCC (variable returns to scale) model.

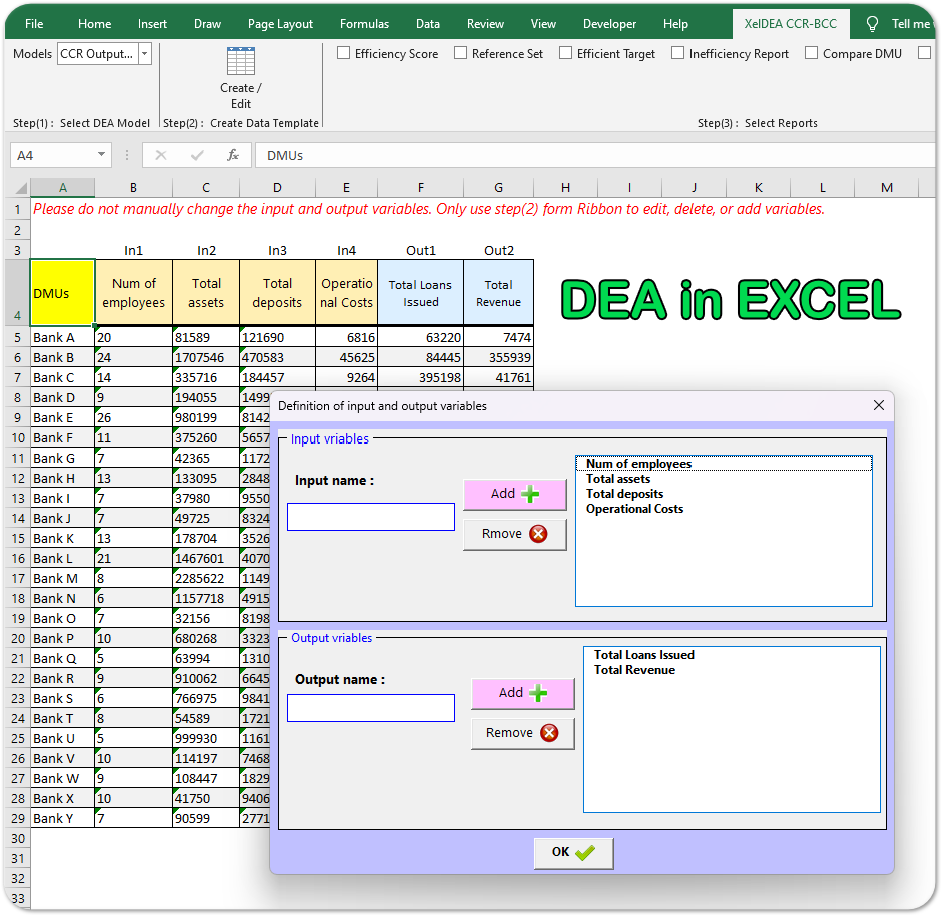
Step 2: Setting Up the Data in Excel
We will analyze the efficiency of 25 banks using DEA. Our input and output variables are:
Inputs: Number of employees, total assets, total deposits, operating costs
Outputs: Total loans, total revenue
To begin, we open XelDEA in Excel and create a template for our dataset.
Steps:
Click on the XelDEA Ribbon in Excel.
Select Create Data Template.
Enter the names of input and output variables.
Click OK to generate the template.
Copy and paste the DMU names and their input/output values into the sheet.
Step 3: Running the DEA Model
To compute Scale Efficiency in Excel, we run two different models:
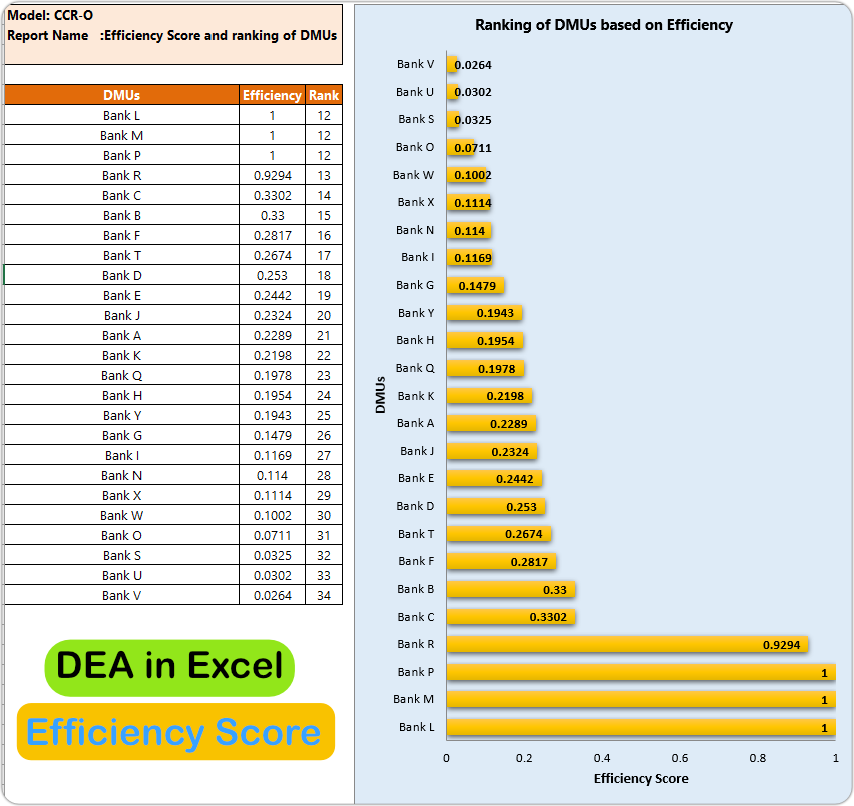
✅ CCR Model (Constant Returns to Scale)
Select CCR-Output Oriented from the XelDEA ribbon.
Choose the required reports.
Click RUN to generate the efficiency scores.
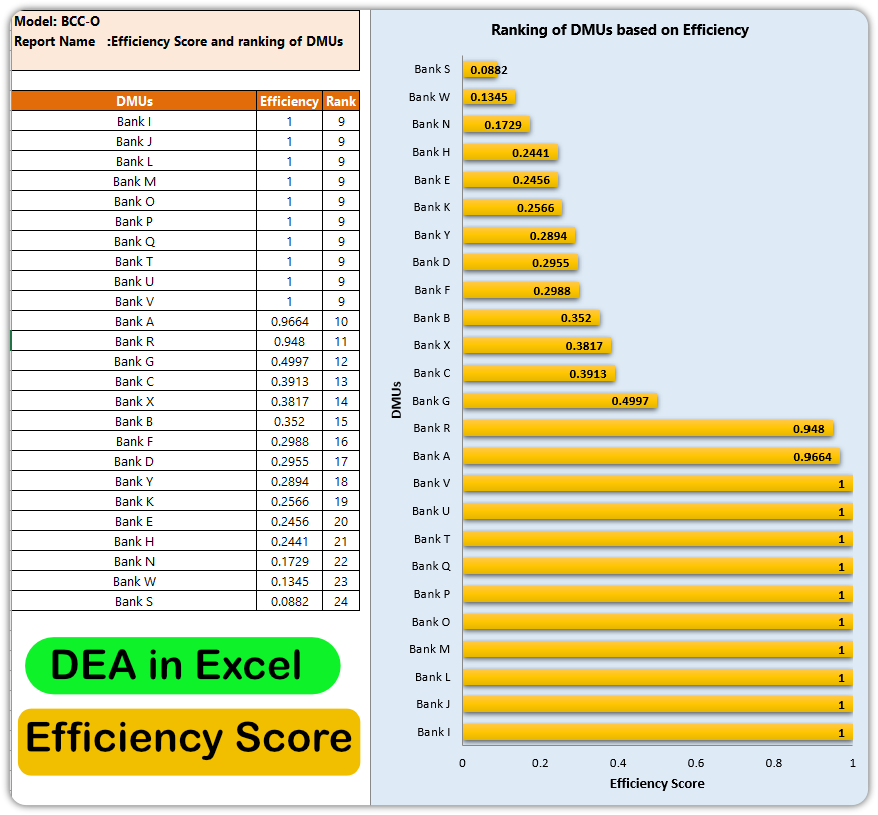
✅ BCC Model (Variable Returns to Scale)
Select BCC-Output Oriented from the XelDEA ribbon.
Click RUN to generate the efficiency scores.
The results will be displayed in separate sheets within Excel.
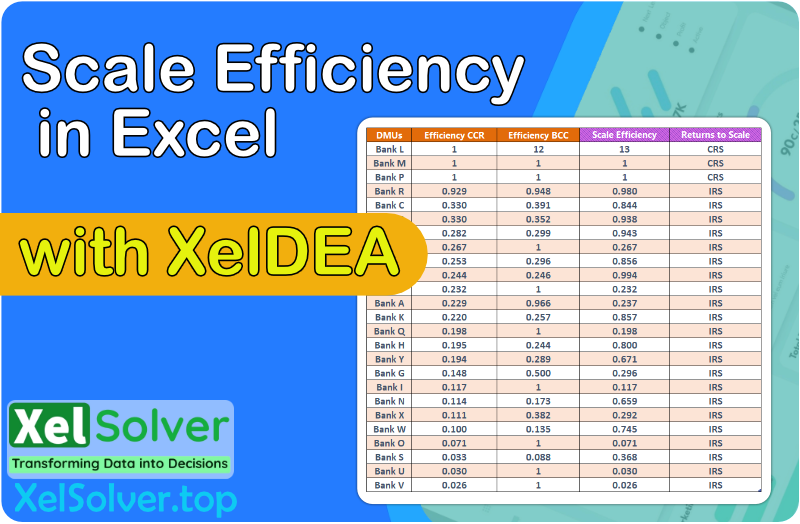
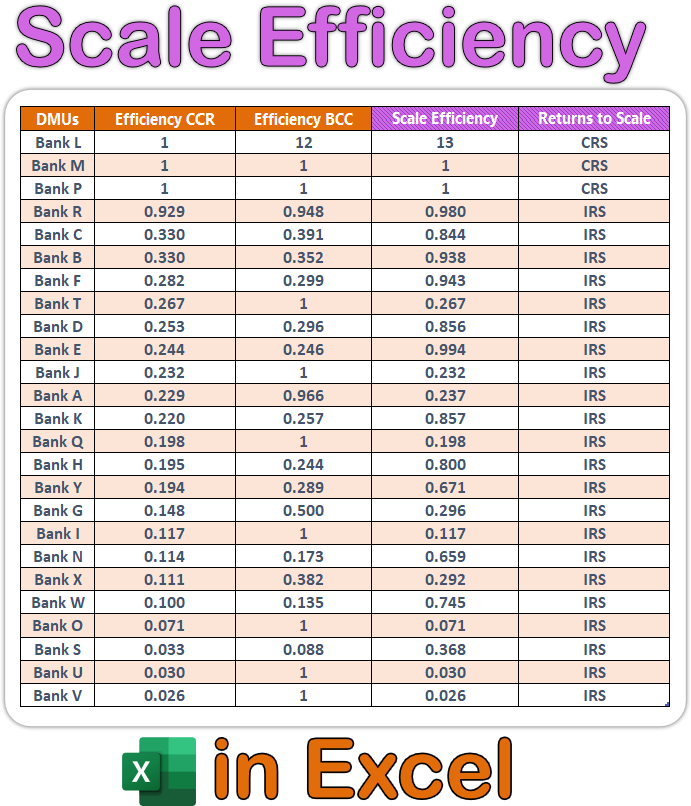
Step 4: Interpreting Scale Efficiency in Excel & RTS
Scale Efficiency (SE) is calculated as:
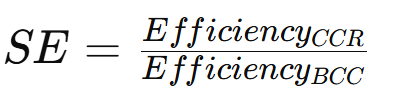
If SE = 1, the DMU is operating at an optimal scale.
If SE < 1, the DMU is experiencing scale inefficiency.
To determine Returns to Scale (RTS):
If CCR efficiency = BCC efficiency, the DMU operates under constant returns to scale (CRS).
If CCR efficiency < BCC efficiency, the DMU operates under increasing returns to scale (IRS) (suggesting potential for expansion).
If CCR efficiency > BCC efficiency, the DMU operates under decreasing returns to scale (DRS) (suggesting the organization is too large and should downsize).
✅ Graphical Reports:
XelDEA generates efficiency scores and visual rankings.
The Reference Set report shows the best-performing DMUs as benchmarks.
The Slack Report identifies inefficiencies in input and output utilization.
Conclusion
Using XelDEA in Excel, we efficiently calculate Scale Efficiency in Excel and identify returns to scale for each DMU. Organizations can leverage these insights to adjust their operations for optimal productivity.
📌 Try XelDEA today and optimize your efficiency analysis with just a few clicks!
Academic References:
Banker, R. D., Charnes, A., & Cooper, W. W. (1984). Some models for estimating technical and scale inefficiencies in data envelopment analysis. Management Science, 30(9), 1078-1092. DOI: 10.1287/mnsc.30.9.1078
Cooper, W. W., Seiford, L. M., & Tone, K. (2007). Data Envelopment Analysis: A Comprehensive Text with Models, Applications, References and DEA-Solver Software. Springer. DOI: 10.1007/978-0-387-45283-8
Färe, R., Grosskopf, S., & Lovell, C. A. K. (1994). Production Frontiers. Cambridge University Press. DOI: 10.1017/CBO9780511554441
Emrouznejad, A., Parker, B. R., & Tavares, G. (2008). Evaluation of research in efficiency and productivity: A survey and analysis of the first 30 years of scholarly literature in DEA. Socio-Economic Planning Sciences, 42(3), 151-157. DOI: 10.1016/j.seps.2007.07.002
Cook, W. D., Tone, K., & Zhu, J. (2014). Data envelopment analysis: Prior to choosing a model. Omega, 44, 1-4. DOI: 10.1016/j.omega.2013.09.004
Online Resources:
IGI Global. (n.d.). Scale Efficiency Definition & Meaning. Retrieved from https://www.igi-global.com/dictionary/bank-branch-efficiency-with-dea/39596
Sciencedirect.com. (n.d.). Various research articles on DEA and scale efficiency. Retrieved from https://www.sciencedirect.com/
SpringerLink. (n.d.). Books and articles on efficiency analysis. Retrieved from https://link.springer.com/