2025 Complete Guide to Data Envelopment Analysis (DEA) in Excel – Efficiency Analysis Made Easy
What is Data Envelopment Analysis (DEA in excel)?
Data Envelopment Analysis (DEA) is a powerful quantitative method used for efficiency analysis and performance evaluation in various industries. Developed by Charnes, Cooper, and Rhodes in 1978, DEA is a non-parametric technique based on linear programming. It helps in assessing the relative efficiency of Decision Making Units (DMUs) such as banks, hospitals, universities, manufacturing plants, and retail chains.
Unlike traditional efficiency measurement methods, DEA does not require predefined weight assumptions, making it highly flexible and adaptable to different datasets and industries.
Why Use DEA in Excel for Performance Evaluation?
Measuring efficiency is crucial for businesses and policymakers to optimize resources, cut costs, and enhance productivity. DEA offers a data-driven approach to efficiency measurement by identifying the most effective units and providing recommendations for improvement.
Key Advantages of DEA in Excel Analysis:
✔ Objective Measurement – No need for subjective weight assignments.
✔ Benchmarking Tool – Identifies best-performing units for comparison.
✔ Flexibility – Applicable in various industries, from healthcare to banking.
✔ Identifies Inefficiencies – Highlights areas for potential improvement.
✔ No Need for Prior Assumptions – Unlike regression-based methods.
Understanding DEA Models: CCR vs. BCC
DEA has multiple models based on the assumption of returns to scale:
1. CCR Model (Constant Returns to Scale – CRS)
The CCR model, introduced by Charnes, Cooper, and Rhodes, assumes that increasing inputs proportionally results in the same increase in outputs. It is best suited for scenarios where all units operate at an optimal scale.
2. BCC Model (Variable Returns to Scale – VRS)
Developed by Banker, Charnes, and Cooper, the BCC model allows for variable returns to scale, meaning that increasing inputs may lead to increasing, decreasing, or constant outputs. This model is useful when efficiency varies due to operational scale differences.
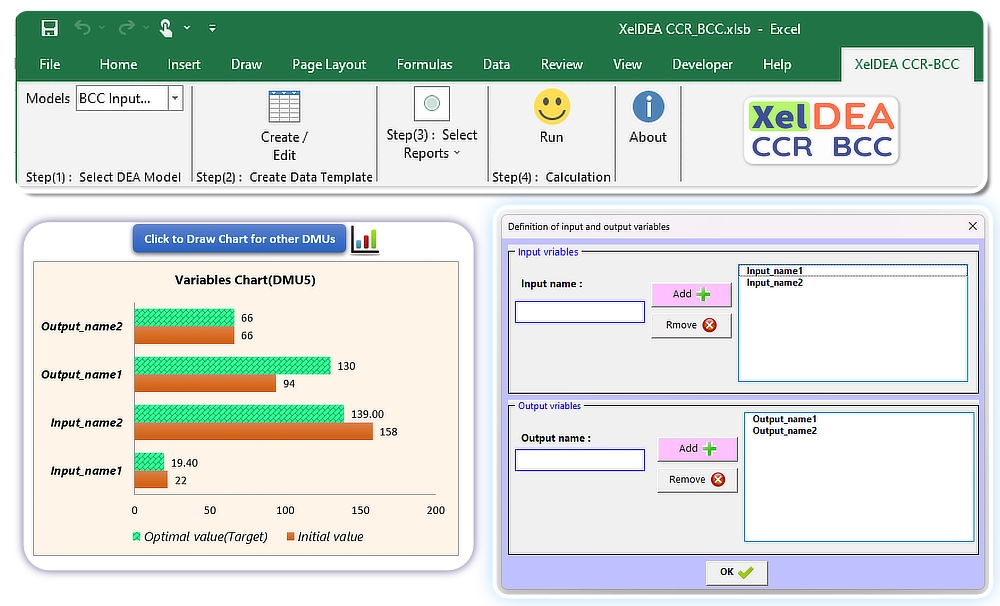
DEA in Excel – How to Perform Analysis Without Coding?
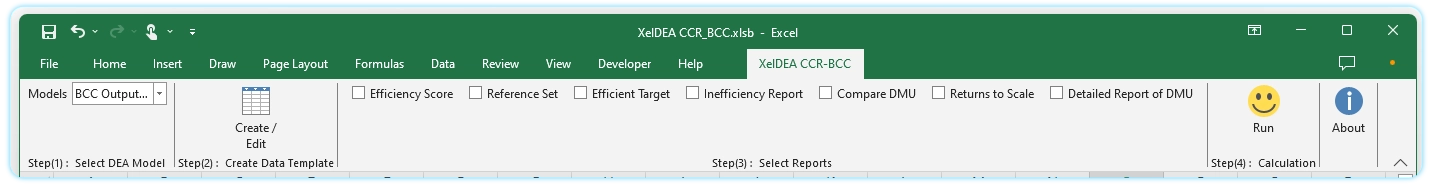
Traditionally, conducting DEA analysis required advanced coding in MATLAB, R, or Python. However, with modern DEA Excel tools, you can now perform efficiency analysis directly in Microsoft Excel without programming knowledg
Benefits of Using DEA in Excel:
✅ User-Friendly Interface – No coding required.
✅ Automation of DEA Models – No manual calculations needed.
✅ Customizable Reports – Generate tailored efficiency reports.
✅ Quick Data Processing – Analyze thousands of DMUs efficiently.
Key Features of DEA in Excel
Choosing the right DEA software can significantly improve workflow and reduce analysis time. Here are some essential features to look for:
-
DEA Solver for Excel – Automates linear programming calculations.
-
User-Friendly DEA Software – Simple interface for researchers and managers.
-
DEA Automation in Excel – Reduces manual work and minimizes errors.
-
No Coding DEA Software – Eliminates the need for programming knowledge.
-
Visual Data Representation – Graphs and charts to compare efficiency scores.
Input-Oriented vs. Output-Oriented DEA Models
DEA models are classified into two main orientations:
1. Input-Oriented DEA
-
Focuses on reducing inputs while maintaining the same level of output.
-
Useful for cost reduction and resource optimization.
-
Example: A hospital minimizing staff hours while maintaining service quality.
2. Output-Oriented DEA
-
Focuses on maximizing outputs while keeping inputs constant.
-
Ideal for growth and productivity improvement.
-
Example: A bank increasing the number of loans processed with the same number of employees.
Who Can Benefit from DEA Analysis?
DEA is widely used across multiple industries for decision-making and performance benchmarking:
🔹 DEA for Researchers & Economists – Academic studies on efficiency measurement.
🔹 DEA for Business Decision Makers – Evaluating company performance.
🔹 DEA for Operations Research Analysts – Identifying operational bottlenecks.
🔹 DEA for Government Agencies – Policy evaluation and resource allocation.
🔹 DEA for Healthcare Administrators – Hospital and medical service efficiency.
Choosing the Best DEA Software for Your Needs
There are multiple DEA tools for Excel, each with different capabilities. When selecting software, consider:
-
Ease of Use – Does it have a friendly interface?
-
Scalability – Can it handle large datasets?
-
Visualization Options – Are results presented in clear graphs and tables?
-
Integration – Does it work seamlessly within Excel?
-
Cost-Effectiveness – Is it affordable compared to traditional DEA software?
For those looking for an advanced DEA modeling software, selecting a DEA tool for Excel ensures seamless integration and ease of use. Whether you need a DEA solver for Excel or a comprehensive efficiency measurement tool, there are solutions available to match your requirements.
Final Thoughts on DEA in Excel
Data Envelopment Analysis is a powerful and flexible technique for efficiency analysis across various domains. Implementing DEA in Excel can significantly improve business efficiency measurement and decision-making. With the right tools, you can perform DEA analysis effortlessly and make data-driven strategic decisions.
🎯 Want to simplify DEA calculations? Discover how our XelDEA CCR-BCC Software can help you analyze efficiency effortlessly today!