Bank Efficiency Analysis with DEA in Excel – A Practical Guide Using Real Data
Table of Contents (DEA in Excel)
✅Introduction: Why Bank Efficiency Matters?
DEA in Excel is one of the most effective ways to measure efficiency and performance across various industries, especially in banking. With Excel’s flexibility and computational power, conducting Data Envelopment Analysis (DEA) becomes more accessible, allowing decision-makers to evaluate efficiency without complex coding or specialized software. In this guide, we will demonstrate how to use DEA in Excel with real-world banking data, helping you make informed decisions based on performance evaluation.
🔹 The Importance of Bank Efficiency Analysis (DEA in Excel)
Banks play a crucial role in economic stability by efficiently allocating financial resources. An efficient bank maximizes outputs (loans, revenues) while minimizing inputs (staff, assets, costs). Measuring bank efficiency is vital for:
- Regulators to ensure financial stability and fair competition.
- Investors & Analysts to assess profitability and risk.
- Bank Managers to optimize resource allocation and strategic planning.
However, determining efficiency is not straightforward due to the complexity of banking operations.
🔹 Challenges in Evaluating Bank Performance
Unlike manufacturing industries where output is tangible, banks provide financial services, making performance measurement more challenging. Key challenges include:
- Multiple Inputs & Outputs – Banks use various resources (capital, labor) to produce different services (loans, deposits, revenues).
- Traditional Ratio Analysis Limitations – Common financial ratios (ROA, ROE) fail to capture efficiency comprehensively.
- Market & Regulatory Influences – External factors impact performance beyond managerial control.
Given these complexities, a more advanced, data-driven method is required.
🔹 DEA in Excel: A Standard Method for Bank Efficiency Analysis
Data Envelopment Analysis (DEA) is a widely accepted methodology for evaluating bank efficiency. DEA is a non-parametric mathematical approach that:
✔ Measures the relative efficiency of banks by comparing them to the best-performing institutions.
✔ Accounts for multiple inputs and outputs simultaneously, unlike traditional financial ratios.
✔ Identifies inefficient banks and provides recommendations for improvement.
By using DEA in Excel, analysts, economists, and decision-makers can efficiently assess bank performance without requiring advanced statistical knowledge or programming skills. In this post, we demonstrate how to apply DEA in Excel using XelDEA CCR-BCC for real-world bank data.
Performing DEA analysis in Excel provides a practical approach to measuring efficiency
✅What is Data Envelopment Analysis (DEA) and Why Use it in Excel?
🔹 Introduction to DEA and Its Models (CCR & BCC)
Data Envelopment Analysis (DEA) is a powerful mathematical approach for evaluating the efficiency of decision-making units (DMUs), such as banks, hospitals, or companies. Unlike traditional performance metrics, DEA considers multiple inputs and outputs simultaneously, making it ideal for assessing complex systems.
DEA primarily operates through two foundational models:
✔ CCR Model (Charnes, Cooper, and Rhodes – 1978)
- Assumes Constant Returns to Scale (CRS) – meaning efficiency does not change with the size of the unit.
- Best suited for industries where all banks operate under similar conditions.
✔ BCC Model (Banker, Charnes, and Cooper – 1984)
- Assumes Variable Returns to Scale (VRS) – allowing efficiency to vary based on size.
- Ideal for banking, where institutions differ in size, structure, and market conditions.
Both models help in identifying efficient banks and inefficient ones, offering insights for performance improvement.
🔹 Why Use DEA in Excel for DEA Analysis?
While DEA can be implemented using programming languages like R, Python, or specialized statistical software (e.g., MATLAB, Stata), DEA in Excel remains the most accessible and widely used tool for financial analysts, researchers, and business professionals.
✔ User-Friendly – No need for coding or complex statistical knowledge.
✔ Flexible & Customizable – Analysts can easily modify data, visualize results, and generate reports.
✔ Widely Available – Excel is standard in most organizations, eliminating the need for additional software.
✔ Integration with Other Business Tools – Excel allows seamless integration with financial models, forecasting tools, and databases.
However, performing DEA in standard Excel requires manual calculations, which can be time-consuming and prone to errors.
🔹 Challenges of Other DEA Tools & Advantages of XelDEA
Traditional DEA tools often suffer from several limitations:
❌ Complex Setup – Many require coding knowledge (R, Python) or expensive software (MATLAB).
❌ Limited Customization – Some tools do not allow easy modification of data or visualizations.
❌ Lack of Automation – Analysts often need to manually adjust models, increasing the risk of errors.
🚀 Why Choose XelDEA for DEA in Excel?
XelDEA is a fully automated Excel-based DEA tool that overcomes these challenges by offering:
✔ No Coding Required – Perform complex DEA analysis with a simple Excel interface.
✔ Pre-Designed Templates – Input data quickly and get instant results.
✔ Advanced Graphical Reports – Visualize efficiency scores, rankings, and comparisons.
✔ Support for Unlimited DMUs & Variables – Analyze large datasets without restrictions.
By leveraging XelDEA in Excel, researchers and analysts can conduct fast, accurate, and efficient DEA studies, making it the best choice for real-world banking efficiency analysis.
✅ Dataset Description: Understanding Bank Efficiency Analysis with DEA in Excel
To analyze bank efficiency using Data Envelopment Analysis (DEA) in Excel, we will use a hypothetical dataset of 25 banks (Bank A, Bank B, Bank C, …, Bank Y). Each bank operates with different levels of resources (inputs) and generates different outputs.
📌 Inputs (Resources Used by Banks)
These are the resources each bank utilizes to operate:
🔹 Number of Employees – Total staff working in the bank.
🔹 Total Assets – The overall value of all assets owned by the bank.
🔹 Total Deposits – The amount of money customers have deposited.
🔹 Operational Costs – Expenses related to running the bank (salaries, rent, etc.).
📌 Outputs (Results Achieved by Banks)
These are the results banks generate from their inputs:
🔹 Total Loans Issued – The total amount of loans granted to customers.
🔹 Total Revenue – The total earnings generated by the bank from various activities.
By applying DEA (CCR & BCC models) in Excel, we can determine how efficiently each bank is using its resources to generate outputs. XelDEA automates this process, providing efficiency scores, performance comparisons, and recommendations for improvement.
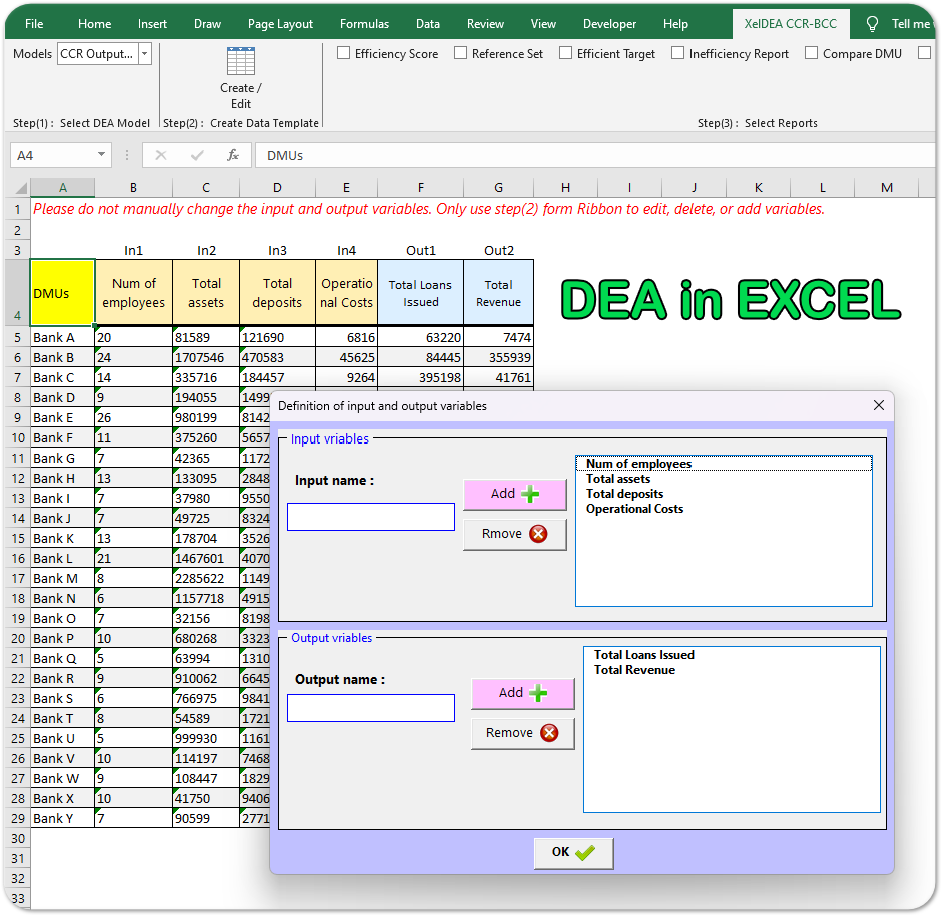
Step 1: Entering Data into XelDEA – Quick & Easy Setup
Once you open XelDEA, a dedicated ribbon tab is added to the top of your Excel interface. This ribbon provides an intuitive and structured way to set up and run Data Envelopment Analysis (DEA) without any coding or complex configurations.
🔹 Creating a Data Entry Template
To begin your analysis, follow these steps:
1️⃣ Click on the “Create Template” button in the XelDEA ribbon.
2️⃣ A form will appear, prompting you to enter the names of your input and output variables.
- Inputs: Number of Employees, Total Assets, Total Deposits, Operational Costs
- Outputs: Total Loans Issued, Total Revenue
3️⃣ Click Confirm, and XelDEA will automatically generate a structured template in a new sheet named “DMU”.
4️⃣ Now, you can enter data for each bank in the provided table.
This automated setup ensures that your dataset is formatted correctly, eliminating manual errors and making DEA analysis in Excel effortless!
Choosing Input-Oriented vs. Output-Oriented DEA for Bank Efficiency Analysis
When conducting DEA (Data Envelopment Analysis) for banks, selecting the appropriate model—input-oriented or output-oriented—depends on the strategic goals and operational focus of the analysis. Here’s a logical framework to help decide:
1️⃣ Input-Oriented DEA: Minimizing Resource Utilization
👉 Use this model when the bank aims to optimize resource efficiency.
- Logic: Banks operate with limited resources (employees, assets, deposits, and operational costs). An input-oriented approach identifies waste and inefficiencies in resource usage while maintaining the same level of financial performance.
- Key Question: Can the bank achieve the same level of loans and revenue with fewer resources?
- Use Case:
- Reducing operational costs without affecting services.
- Optimizing branch staffing to improve efficiency.
- Allocating capital more effectively across branches.
✅ Example: If two banks generate the same revenue, but one has higher costs and more employees, the inefficient bank can learn how to cut unnecessary expenses while maintaining its revenue level.
2️⃣ Output-Oriented DEA: Maximizing Performance & Growth
👉 Use this model when the bank’s focus is on growth and maximizing financial outcomes.
- Logic: Instead of minimizing inputs, this model evaluates how well a bank maximizes its financial outputs (loans issued, revenue) given its available resources.
- Key Question: Can the bank generate more revenue and loans with the same level of resources?
- Use Case:
- Increasing loan issuance without raising operational costs.
- Maximizing profitability per employee.
- Improving branch performance while keeping expenses constant.
✅ Example: If two banks have equal resources, but one generates significantly higher revenue, the less efficient bank should adopt strategies from the more productive one to improve financial output.
📌 Which Model to Use for Banks?
✔ If cost reduction & operational efficiency are priorities → Input-Oriented DEA
✔ If revenue growth & performance maximization are priorities → Output-Oriented DEA
🚀 Best Practice: Many banks analyze both models to get a comprehensive efficiency assessment before making strategic decisions.
For this bank efficiency analysis, we use the output-oriented DEA model, as the primary goal is to maximize financial performance (loans issued and total revenue) while keeping resource usage constant.

✅ Step 2: Running DEA Analysis (CCR & BCC Models)
After entering the data, follow these steps to run the DEA analysis in XelDEA:
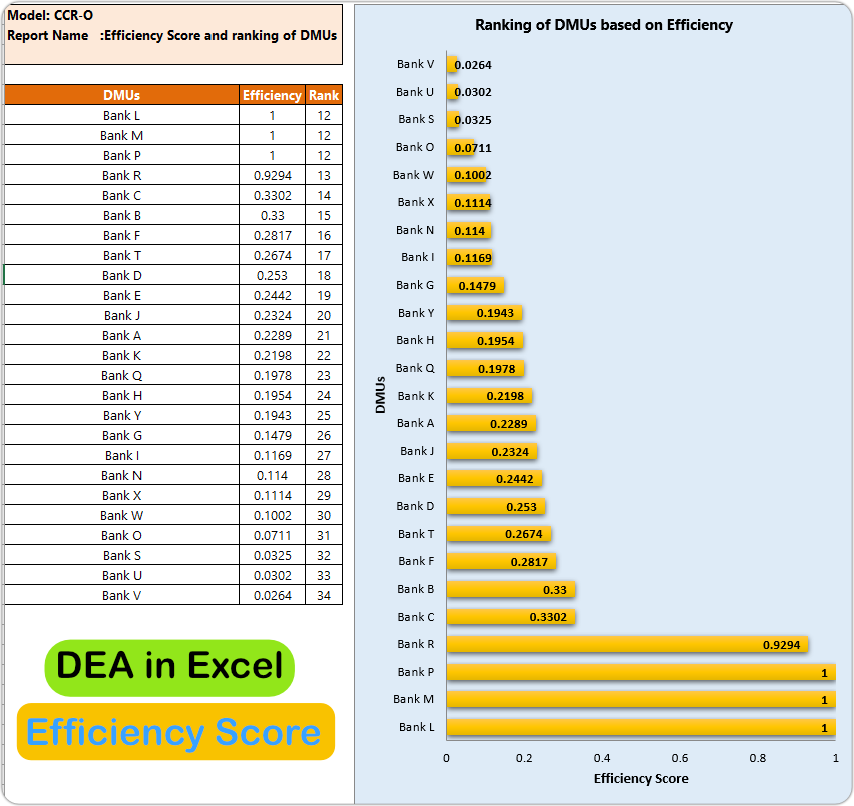
1️⃣ Select the CCR Output-Oriented Model
- From the XelDEA ribbon, choose CCR (Output-Oriented).
- Check the required reports, such as Efficiency Scores, Reference Sets, and Performance Charts.
- Click RUN to generate the results.
2️⃣ Analyze the CCR Results
- View the efficiency scores for each bank.
- Identify inefficient banks and their reference benchmarks.
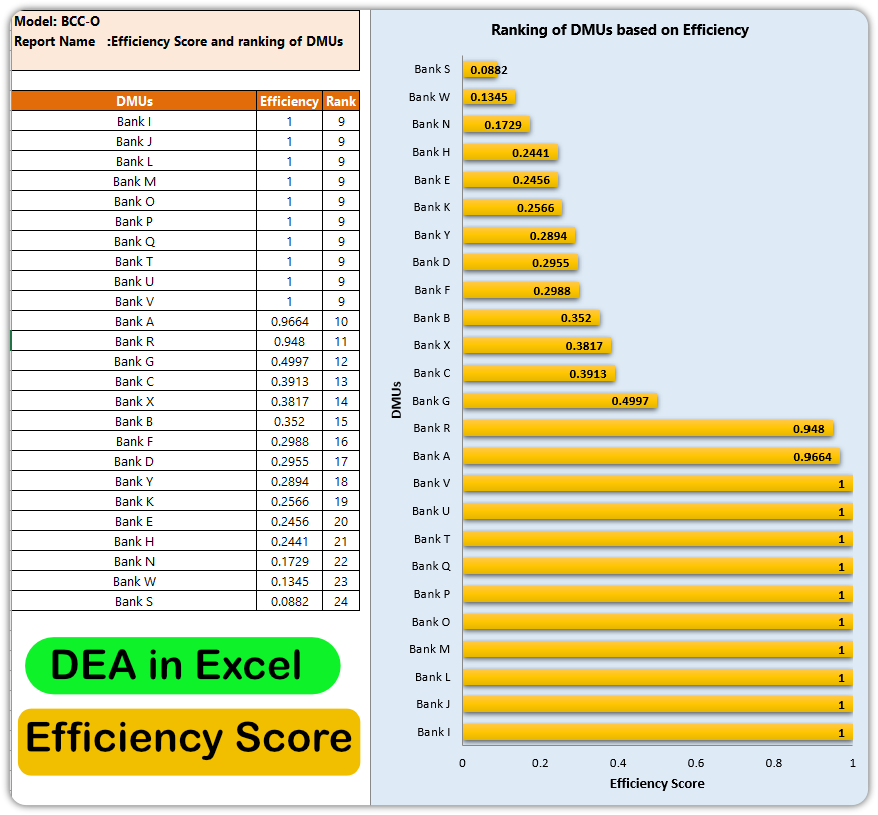
3️⃣ Switch to the BCC Output-Oriented Model
- From the XelDEA ribbon, now select BCC (Output-Oriented).
- Choose additional reports like Returns to Scale Analysis.
- Click RUN to generate results and compare with the CCR model.
By analyzing both models, we can determine whether inefficiency is due to scale or operational performance, providing deeper insights into each bank’s efficiency.
✅ Step 3: Interpreting the Results
After running the DEA analysis, XelDEA generates multiple reports that provide valuable insights into the efficiency of each bank. Below are the key outputs and their interpretations:
1️⃣ Efficiency Scores & Ranking
This report shows the efficiency score of each bank, ranking them based on their performance. A score of 1 (100%) means the bank is fully efficient, while lower scores indicate room for improvement.
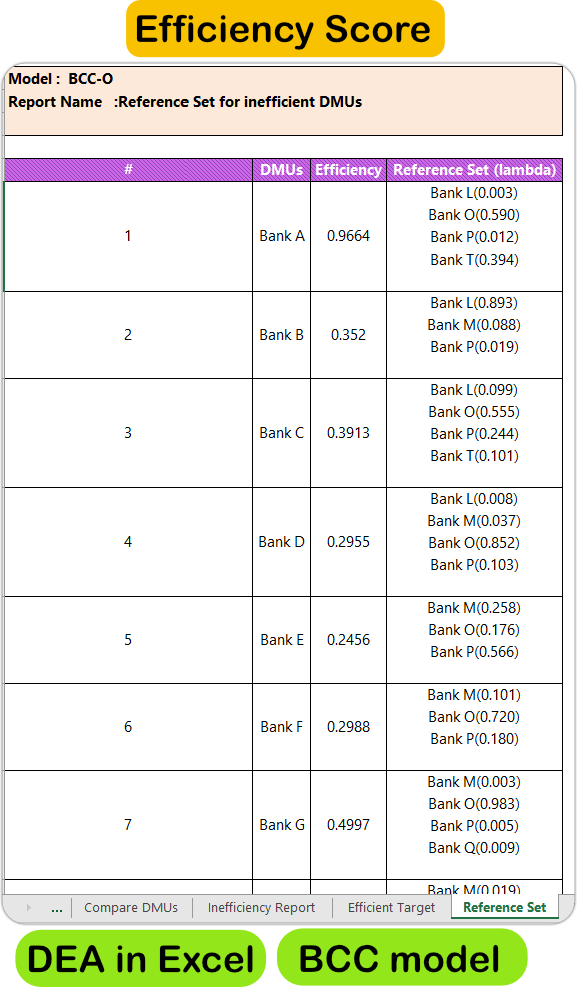
2️⃣ Reference Set for Inefficient Banks
For banks that are not 100% efficient, this report identifies efficient banks as benchmarks for improvement. These reference banks serve as best-practice examples.

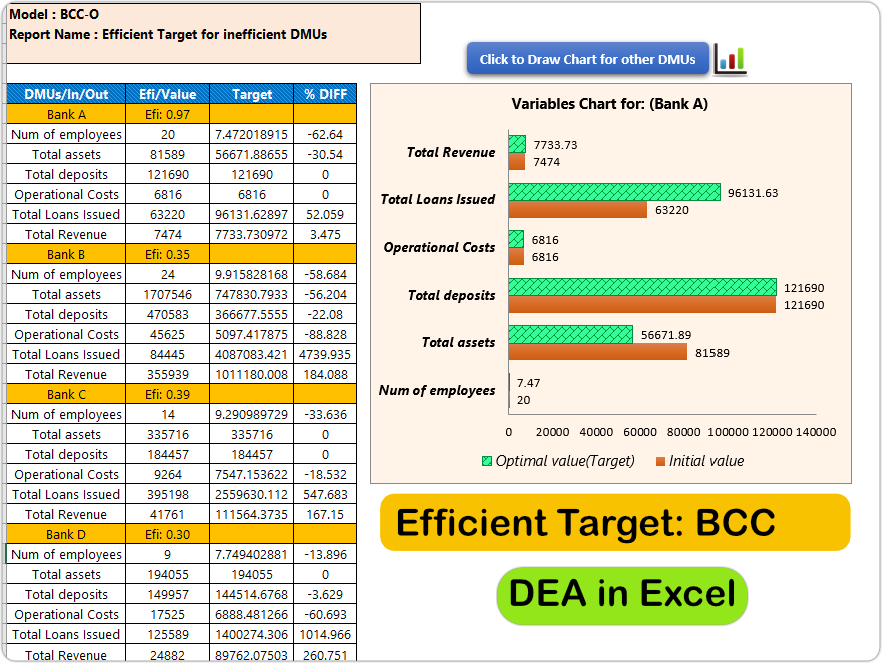
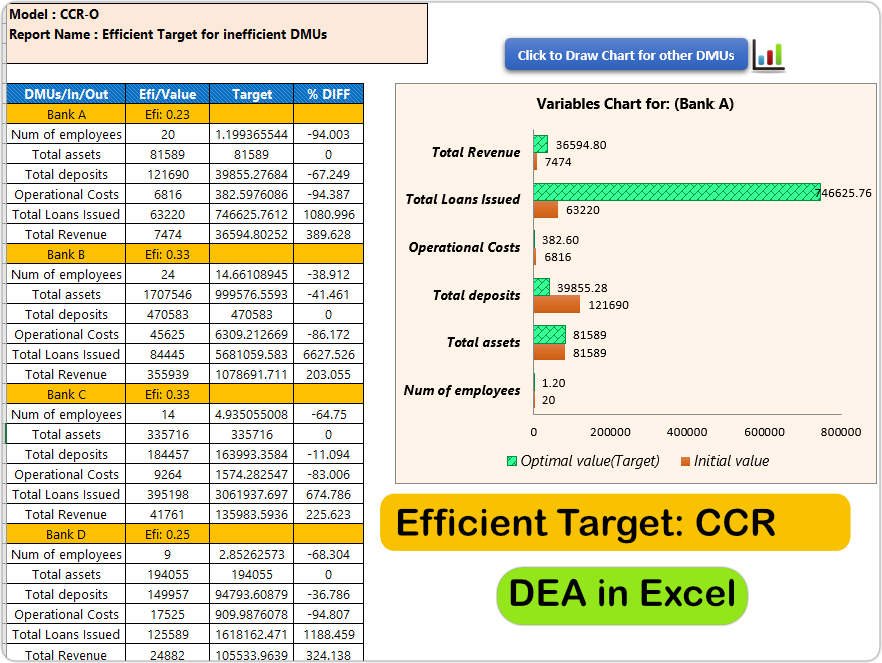
3️⃣ Optimized Targets for Inefficient Banks
This output suggests adjustments needed in inputs and outputs for inefficient banks to reach full efficiency. It helps decision-makers plan for performance enhancement.
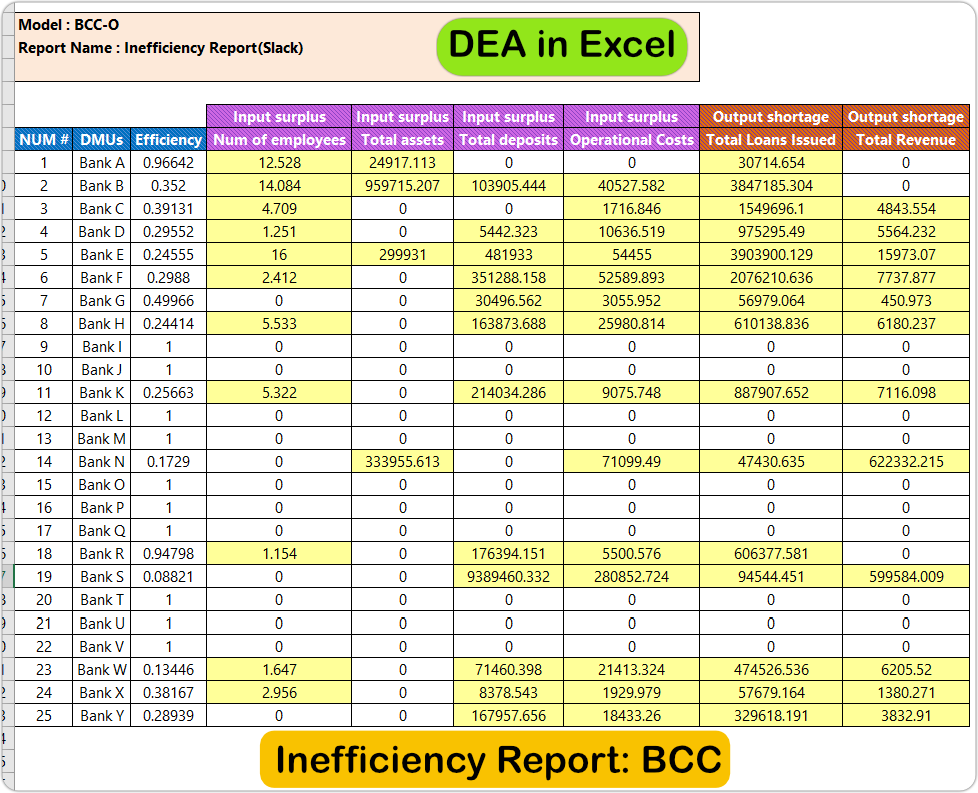
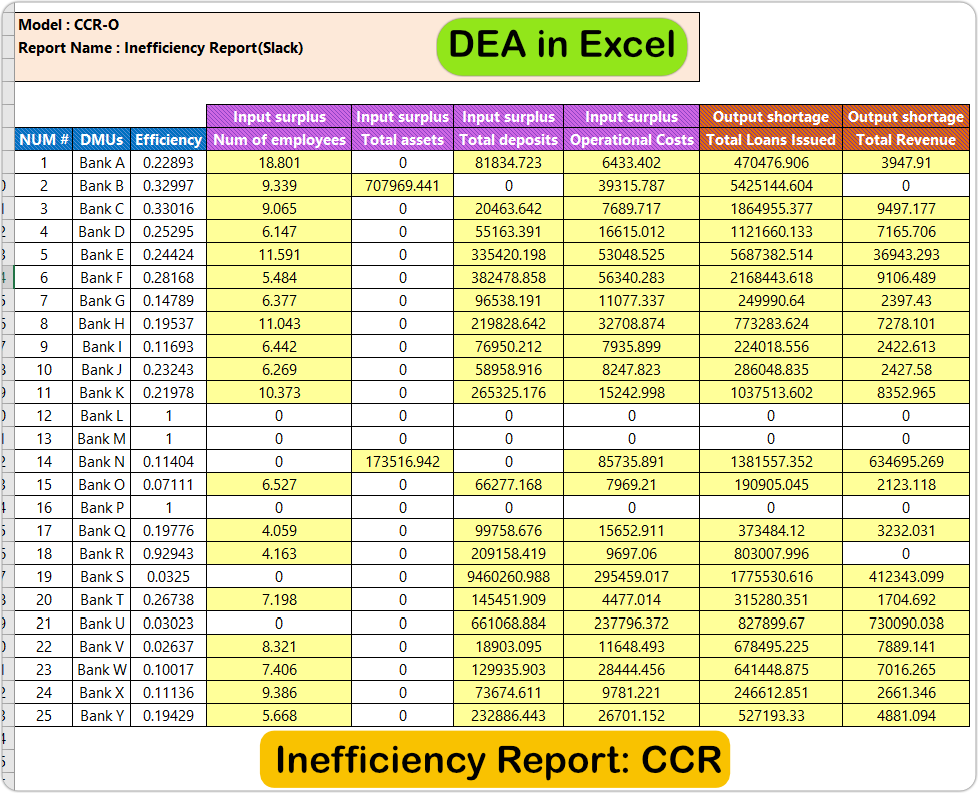
4️⃣ Slack Analysis & Inefficiency Reports
This report highlights unused capacity or excess resources that contribute to inefficiency, helping managers optimize resource allocation.
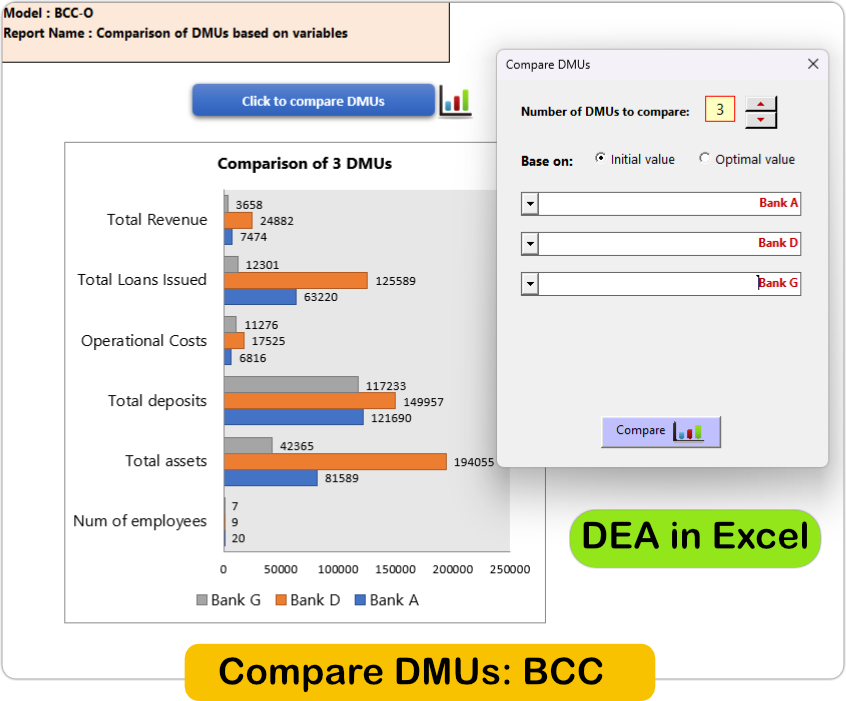
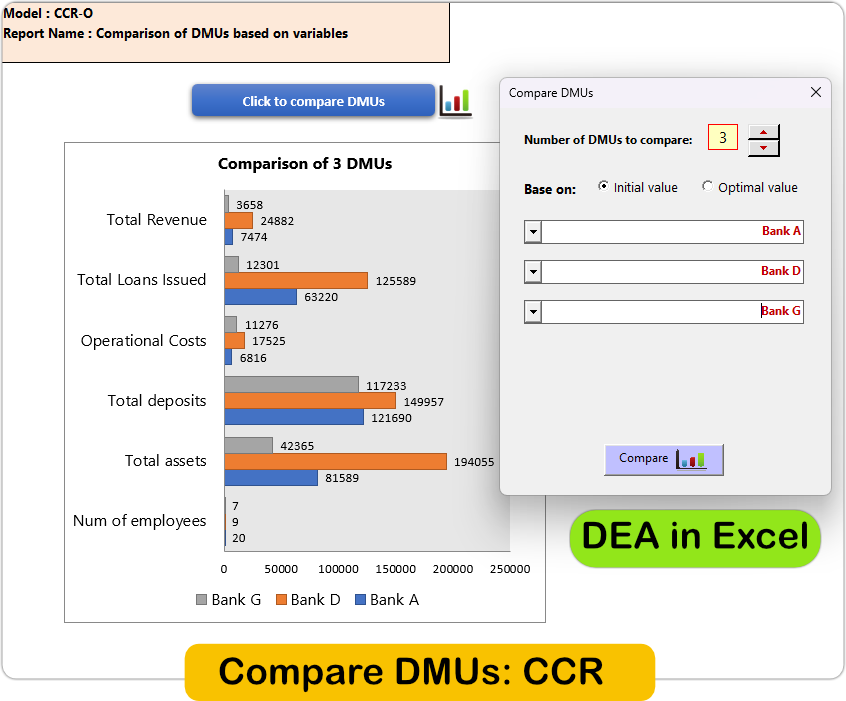
5️⃣ DMU Comparison Charts (Input/Output Adjustments)
Visual charts comparing the banks based on their inputs and outputs. These charts help in quickly
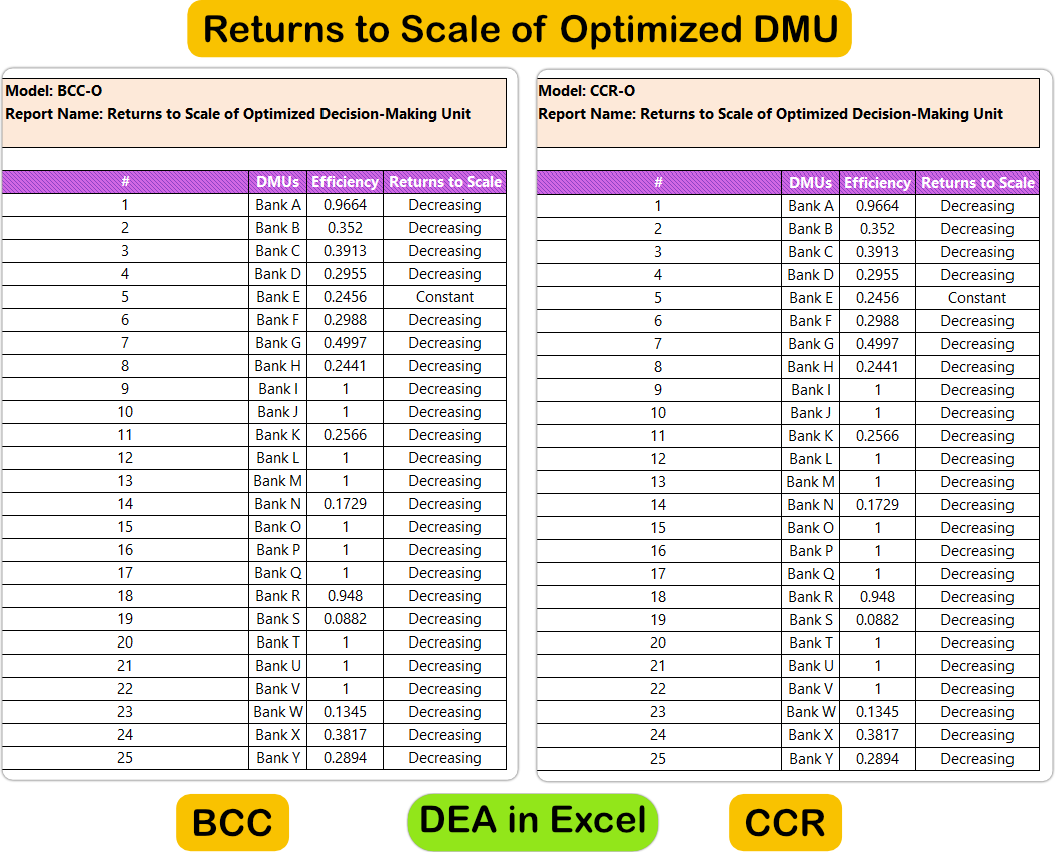
6️⃣ Returns to Scale Analysis
Determines whether a bank’s inefficiency is due to operational factors or scale inefficiency (being too large or too small).
References
Charnes, A., Cooper, W. W., & Rhodes, E. (1978). Measuring the efficiency of decision-making units. European Journal of Operational Research, 2(6), 429-444.
DOI LinkCooper, W. W., Seiford, L. M., & Tone, K. (2007). Data Envelopment Analysis: A Comprehensive Text with Models, Applications, References and DEA-Solver Software.
Springer Link
Bank Efficiency Analysis using DEA – ResearchGate
ResearchGate LinkWorld Bank – Efficiency Analysis in Banking Sector
World Bank LinkEuropean Central Bank – Bank Performance & Efficiency Reports
ECB LinkDEA Solver for Excel – University of Warwick
University of Warwick